Data Exploration Using SQL
In this project, we took covid dataset and made analysis using SQL queries about Covid deaths and Covid Vaccinations

In this project, we took covid dataset and made analysis using SQL queries about Covid deaths and Covid Vaccinations

It is beneficial for banks to understand what motivates a client to leave the company. Churn prevention enables businesses to create loyalty programmes and retention campaigns in order to retain as many customers as possible. This visualisation was created with PowerBI, and various features such as slicers, actions, intellisense, powerpivot, powerquery, and powermodelling were used.

In this project, we made use of the 'tweepy' package and api's to extract the relevant data from the twitter database. A model to estimate the number of retweets based on the number of followers has been developed by performing EDA initially, followed by training and testing with a decision tree classifier algorithm.
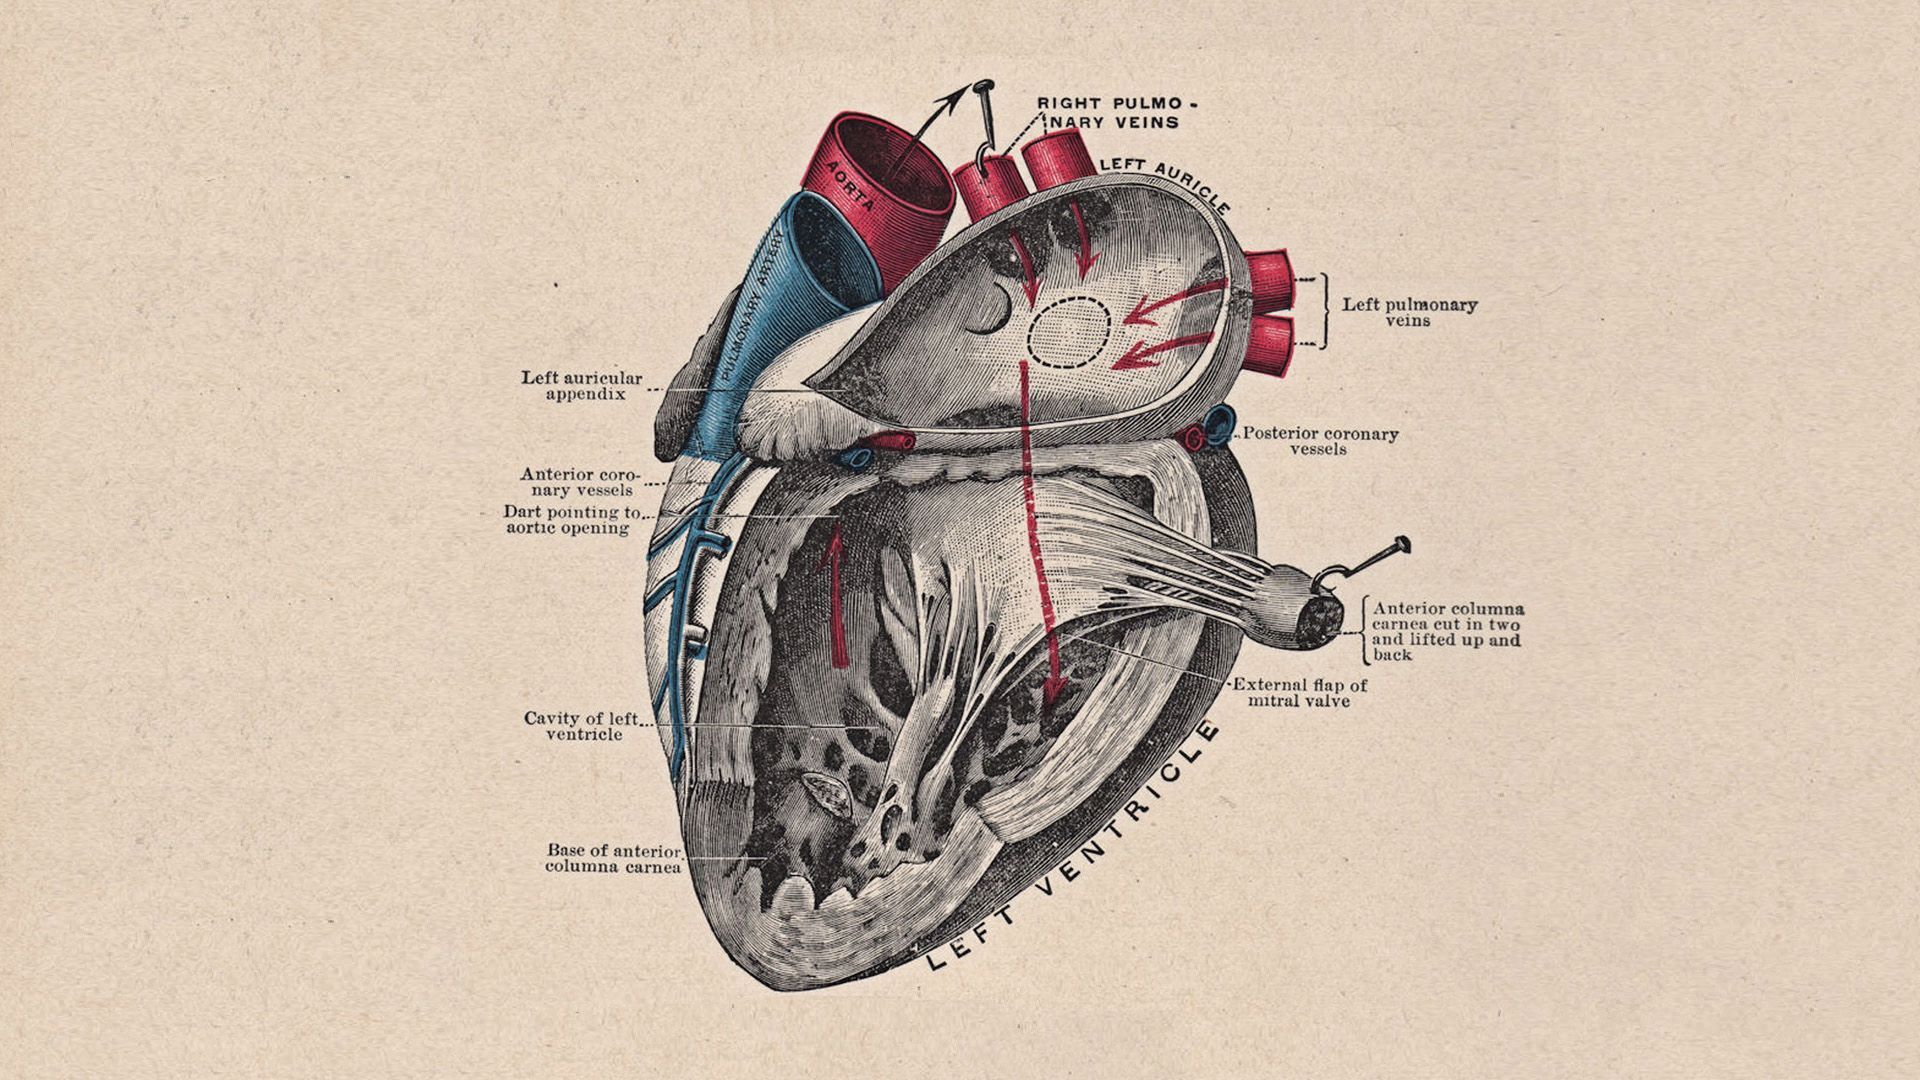
We conducted exploratory data analysis on components in this research that may be suspected of causing heart disease in the near future. A model has been created based on these variables to determine whether all of these symptom-inducing elements can eventually result in the development of heart disease.

In this virtual work experience programme, web scraping is done on the skytrax website, which contains airline reviews. The data pertaining to British Airways was scraped and cleaned in preparation for further analysis. It is concluded that 60% of the reviews are positive, 39% are negative, and the remainder are neutral.

This project puts to the test several models that are good at predicting the likelihood of developing diabetes in the near future. Several features are considered, and EDA is performed initially. Different classification algorithms were tested, and the MLP classifier was found to have the highest classification accuracy.

This project contains the Bike Sales Dashboard, which was created entirely in Excel. After cleaning the data by removing duplicates, several operations such as IF,WHATIF, SUMIF, and VLOOKUP are used to get the most out of it. Pivot Tables are used to generate more accurate summaries based on gender, and a dashboard is created at the end with slicers and interactions between various graphs.

This Dashboard displays several features through the use of various charts, with actions between the charts incorporated to show how different variables correlate. This is entirely based on Tableau of Fitness Tracker App data in order to gain insights into how consumers use the FitBit app and discover trends and insights for the Bellabeat marketing team.